Create your own functions for package development in R
Session details
- Date of session: 23 Nov, 2018
- Instructor: Luke Johnston
- Session level: Intermediate
- Part of the “Package Development Series”
Required packages to install:
Objectives
- To learn how functions are structured and created.
- To learn and apply the typical workflow for creating functions in packages (and in general).
- To properly document and name functions so you don’t forget what they do! 😜
At the end of this session you will be able:
- Create a function with several arguments.
- Add and fill out roxygen documentation to the function.
- Using the “Code”->“Insert Roxygen Skeleton” (
Ctrl-Shift-Alt-R) - Then creating the documentation using `devtools::
- Using the “Code”->“Insert Roxygen Skeleton” (
- Cycle between testing the function out in the
@examplesection and developing the function.- Using
devtools::load_all()(Ctrl-Shift-L). - Run the code in the
@exampleby typingCtrl-Enter. - Repeat until the function does what you want!
- Using
Ultimately, I hope you will try to create a function from your own code by the end of this session!
Resources for learning and help
- Generally, the R Packages book is great for anything related to making packages.
R/chapter in R Packages book (online and free).- Documenting functions chapter in R Packages book.
- Functions chapter in R for Data Science book, also online and free.
- Intro to functions from Software Carpentry.
- Functions in R DataCamp course (need subscription).
- STAT545 on writing functions from University of British Columbia, Canada.
- Very advanced (for those interested) details about functions from Advanced R book (again, online and free).
Initial setup
First we need to create a package layout and create an R script. See the Package Creation session for more details on this.
- Create a package using
usethis::create_package("<pkgname>") - Add an R script using
usethis::use_r("<scriptname>.R").
All actions in R are functions
The + is a function, mean() is a function, [] is a function… everything that does something is called a function in R. So to add 1 with 1:
… is a function that takes 1 and adds 1 to it. It is actually a short form for:
When creating a function, there is always the basic structure of:
- Name of the function (e.g.
mean). - The function call using
function()being assigned<-to the name. This tells R that the name is a function object… that it does some action. - The arguments within the function call,
function(arg1, arg2, arg3). These are the options given to the function (e.g.sum(arg1, arg2)). - The body of the function, that takes the arguments, if any, does some action, and finishes by outputting some result or object at the end (using
return()).
There is no minimum or maximum number of arguments you can provide for a function. E.g. you can have zero arguments or you can have 100s. To keep things sane, try to keep the number of arguments low, like not more than 4 or 5.
So, the structure is:
… and an example:
You can use the new function by running the above code and writing out your new function, with arguments to give it.
The function name is fairly good… add_nums can be read as “add numbers”. But we need to also add some formal documentation to the function. Using the “Insert Roxygen Skeleton” in the “Code” menu list (or by typing Ctrl-Shift-Alt-R) you can add template documentation right above the function. It looks like:
#' Title
#'
#' @param num1
#' @param num2
#'
#' @return
#' @export
#'
#' @examples
add_nums <- function(num1, num2) {
    added <- num1 + num2
    return(added)
}In the Title area, this is where you type out a brief sentence or several words that describe the function. Creating a new paragraph below this line allows you to add a more detailed description. The other items are:
@param numlines are to describe what each argument is for.@returndescribes what output the function provides. Is it a data.frame? A plot? What else does the output give?@exportthis is to tell R that this function should be accessible to the user of your package. Keep it in for now.@exampleslines below this are used to show examples of how to use the function. This is also the area where you write and test that the function does what you want. You can run code here as if it was regular R code and not a commented out code by usingCtrl-Enter.
#' Add two numbers together.
#'
#' This is just an example function to show how to create one.
#'
#' @param num1 A number here.
#' @param num2 A number here.
#'
#' @return Returns the sum of the two numbers.
#' @export
#'
#' @examples
#'
#' add_nums(1, 1)
add_nums <- function(num1, num2) {
    added <- num1 + num2
    return(added)
}
Now, when we run devtools::document() (or Ctrl-Shift-D), a file will be added to the man/ folder. Now, when you type out ?add_nums in the console, the help documentation will pop up on the “Help” tab.
Ok, let’s get to something a bit more interesting. A common thing that people do (at least I do) is to create a similar plot on different variables and datasets. So this is a great example of using a function to simplify your code. We can also cover… package/function dependencies! Since we will use ggplot2 to make the plot, we need some way to tell R that the functions come from ggplot2… It’s very bad practice to use library() in your function and in your package. A function from usethis comes to the rescue! Use usethis::use_package("ggplot2") in the console. Some text will appear saying that “ggplot2 has been added to DESCRIPTION” and that “please refer to functions using ggplot2::fun”. So let’s do that!
scatter_plot <- function(data, xvar, yvar) {
    graph <- ggplot2::ggplot(data = data, ggplot2::aes(x = xvar, y = yvar)) +
        ggplot2::geom_point()
    return(graph)
}
Ok, we have the base for making a scatter plot. But! There are few things to talk about here first. First, ggplot2 will be confused by the x = xvar since it will think1 you are asking for the xvar column in the dataset. So, we need to change aes to aes_string to force ggplot2 to read xvar as a character string that is the name of the column you want to plot. Next, it is useful in many cases to put a dot before your function arguments to differentiate your function arguments from other R objects. Let’s also add the Roxygen documentation. So:
#' Create a scatter plot of two variables.
#'
#' @param .data The dataset.
#' @param .xvar The x-axis variable.
#' @param .yvar The y-axis variable.
#'
#' @return A scatter plot.
#' @export
#'
#' @examples
#'
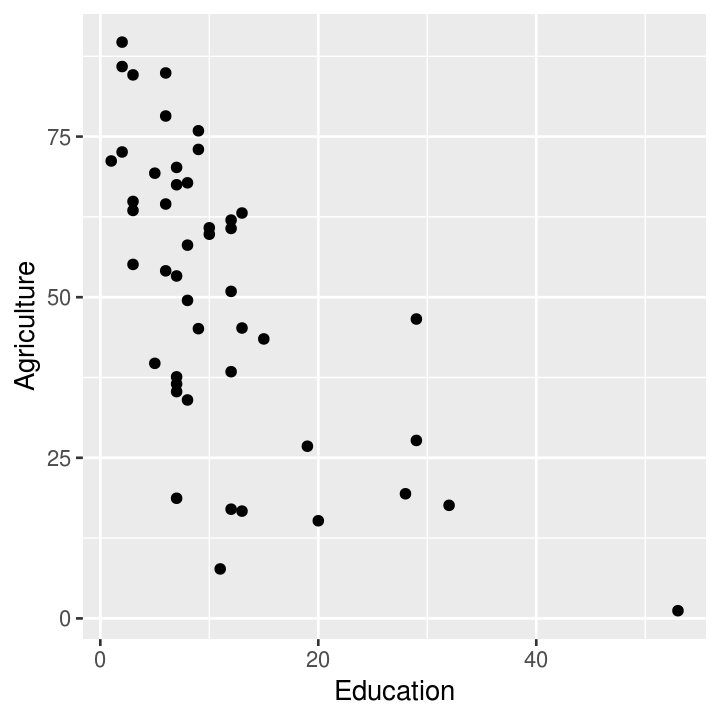
#' scatter_plot(swiss, "Education", "Agriculture")
scatter_plot <- function(.data, .xvar, .yvar) {
graph <- ggplot2::ggplot(data = .data, ggplot2::aes_string(x = .xvar, y = .yvar)) +
ggplot2::geom_point()
return(graph)
}
Now we do devtools::load_all() (Ctrl-Shift-L) and run the code in the example (Ctrl-Enter). A quick note: Running code in the @examples section only works if you are in an R package project (the RStudio .Rproj file). If you are not in an R package, you can instead include the code to run the function below your new function, like so:
#' Create a scatter plot of two variables.
#'
#' @param .data The dataset.
#' @param .xvar The x-axis variable.
#' @param .yvar The y-axis variable.
#'
#' @return A scatter plot.
#' @export
#'
#' @examples
#'
scatter_plot <- function(.data, .xvar, .yvar) {
    graph <- ggplot2::ggplot(data = .data, ggplot2::aes_string(x = .xvar, y = .yvar)) +
        ggplot2::geom_point()
    return(graph)
}
scatter_plot(swiss, "Education", "Agriculture")
Now, if we want to add some theme items, all graphs created from this function will get the new theme and appearance!
#' Create a scatter plot of two variables.
#'
#' @param .data The dataset.
#' @param .xvar The x-axis variable.
#' @param .yvar The y-axis variable.
#'
#' @return A scatter plot.
#' @export
#'
#' @examples
#'
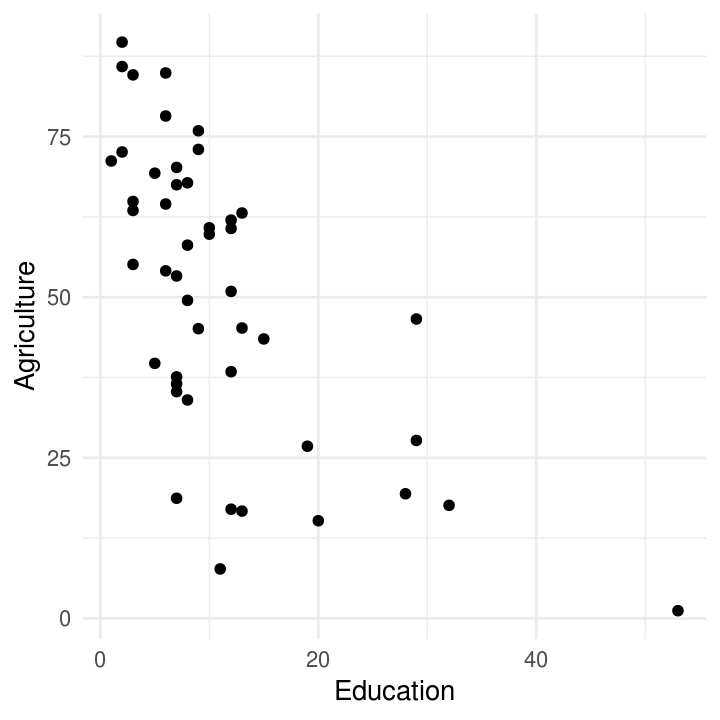
#' scatter_plot(swiss, "Education", "Agriculture")
scatter_plot <- function(.data, .xvar, .yvar) {
graph <- ggplot2::ggplot(data = .data, ggplot2::aes_string(x = .xvar, y = .yvar)) +
ggplot2::geom_point() +
ggplot2::theme_minimal()
return(graph)
}
If you want to make sure that who ever uses your function will not use a wrong argument, you can use “defensive programming” via the stopifnot() function. This forces the code to only work if xvar and yvar are character (e.g. "this") argument.
#' Create a scatter plot of two variables.
#'
#' @param .data The dataset.
#' @param .xvar The x-axis variable.
#' @param .yvar The y-axis variable.
#'
#' @return A scatter plot.
#' @export
#'
#' @examples
#'
#' scatter_plot(swiss, "Education", "Agriculture")
scatter_plot <- function(.data, .xvar, .yvar) {
    stopifnot(is.character(.xvar), is.character(.yvar))
    graph <- ggplot2::ggplot(data = .data, ggplot2::aes_string(x = .xvar, y = .yvar)) +
        ggplot2::geom_point() +
        ggplot2::theme_minimal()
    return(graph)
}
Exercise: Make your own function!
Using this workflow, try to create, document, and test your own function! If you have some code that you already use repeatedly by copy and pasting, try to convert that code into a function. If you don’t have your own code, try converting these pieces of code into their own function:
Other notes
There are a few other things to consider. In R there are different “methods” of functions. This is way above what is necessary for this session, but if you are curious this website has a great explanation of the different methods (e.g. S3 methods). Be warned, the website is fairly advanced!
You can always look at the contents of all functions in R. So an example of an S3 function:
# Generic S3
print
#> function (x, ...)
#> UseMethod("print")
#> <bytecode: 0x428a840>
#> <environment: namespace:base>
# Printing for data.frames
print.data.frame
#> function (x, ..., digits = NULL, quote = FALSE, right = TRUE,
#>     row.names = TRUE)
#> {
#>     n <- length(row.names(x))
#>     if (length(x) == 0L) {
#>         cat(sprintf(ngettext(n, "data frame with 0 columns and %d row",
#>             "data frame with 0 columns and %d rows"), n), "\n",
#>             sep = "")
#>     }
#>     else if (n == 0L) {
#>         print.default(names(x), quote = FALSE)
#>         cat(gettext("<0 rows> (or 0-length row.names)\n"))
#>     }
#>     else {
#>         m <- as.matrix(format.data.frame(x, digits = digits,
#>             na.encode = FALSE))
#>         if (!isTRUE(row.names))
#>             dimnames(m)[[1L]] <- if (isFALSE(row.names))
#>                 rep.int("", n)
#>             else row.names
#>         print(m, ..., quote = quote, right = right)
#>     }
#>     invisible(x)
#> }
#> <bytecode: 0x2478288>
#> <environment: namespace:base>This work is licensed under a Creative Commons Attribution 4.0 International License. See the licensing page for more details about copyright information.